
Solana’s network numbers kept setting records for months while SOL price sat still, then the token finally moved. Record stablecoin volume, a landmark Wall Street ETF, and a rare block-time cut all built the case before the price responded. This article breaks down the network data, the price breakout, and the institutional money that arrived just ahead of it.
Crypto traders love a chart, and for months the SOL chart gave them nothing to talk about. Network engineers, payment processors, and asset managers kept pointing to activity metrics that looked nothing like the price line, and that gap drew attention from people who study market structure for a living. Then, within the same several weeks, the network got faster, a major bank issued a regulated product, and the price line finally started catching up.
What the Price Data Actually Shows
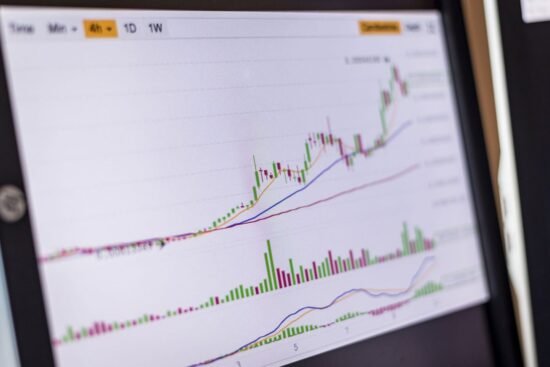
Investors watching SOL day to day wouldn’t exactly have called the summer exciting, but that’s right up until the pattern broke. Checking the sol price usd chart on Binance shows the token trading near $77 through most of July and the first half of August, barely straying outside the mid-$70s to mid-$80s. Earlier in the year, the token had peaked at $146 in January, then dropped 51% to $68 in April, recovering only into an $85-$87 range by May, where it mostly sat through the following months.
On August 21, 2026, that pattern broke. SOL rallied roughly 25% in a single session to touch $93.39 (a level it hadn’t traded at since before the April drawdown), settling near $87.41 after a daily gain above 13%. Daily trading volume, which had hovered near $1 billion for months, jumped alongside it.
Network performance had delivered on every metric long before the token responded, and the August breakout is the first sign that valuation and throughput might be converging rather than running on separate tracks.
Wall Street Validation Expands the Broader Solana Ecosystem
Traditional brokerage accounts are gaining price exposure to Solana through regulated Wall Street products. Rather than competing with spot exchanges, these financial wrappers act as institutional onboarding ramps that validate the asset class, pull traditional capital into the ecosystem, and increase baseline market interest in the underlying token.
Morgan Stanley Investment Management kicked off two new exchange-traded products on NYSE Arca on July 28, 2026: the Morgan Stanley Ethereum Trust and the Morgan Stanley Solana Trust. While these vehicles allow stock portfolios to track price movements and capture staking yields, they offer synthetic exposure without actual token delivery or on-chain functionality, leaving global spot platforms as the sole venues for active trading, 24/7 execution, and real token utility.
MSOL, the Solana Trust’s ticker, carries a 0.14% expense ratio, the lowest fee of any Solana product on the market, according to Morgan Stanley’s own announcement of the launch. Under the traditional 50/30/20 budget rule, 50% of income covers essential needs, 30% goes to discretionary wants, and 20% flows into long-term savings and investments. By offering yield-bearing exposure inside traditional brokerage accounts, products like MSOL shift Solana out of the speculative “wants” category and directly into that 20% investment allocation for mainstream portfolios. Reporting on the fund’s structure indicates Morgan Stanley leans toward staking most of the trust’s SOL, chasing a network reward rate well above what Ethereum staking currently offers.
Building settlement rails, regulated or otherwise, puts skin in the game regardless of where SOL trades tomorrow, and the August breakout suggests price is starting to catch up to that activity rather than ignoring it.
The Network Activity Numbers Are Hard to Ignore
An average throughput of 1,030 transactions per second puts Solana at six times Binance Smart Chain’s pace and 41 times Ethereum’s base layer, according to on-chain data compiled in February 2026. Comparisons like that only capture layer-one activity (Ethereum’s rollups, including Arbitrum, Base, and Optimism, don’t show up in the count), so a fuller picture would need to add that traffic back in.
Solana processed 3.4 billion transactions across February 2026 alone, roughly eight times the total logged by its closest rival, BNB Chain, over the same stretch. Stablecoin transfers told a similar story: the network settled a record $650 billion in stablecoin transactions that month, nearly tripling from January, even as the wider stablecoin market across every blockchain combined pushed toward two trillion dollars for the same period.
Key network metrics worth tracking:
- Average throughput near 1,030 transactions per second, layer-one only.
- 3.4 billion transactions processed in February 2026 alone.
- A record $650 billion in stablecoin transfers that same month.
- Standard transfer fees priced in fractions of a cent.
Daily non-vote transactions averaged 112.6 million across the first quarter of 2026, peaking near 148 million in late January before easing toward 102.7 million by June. Momentum like that doesn’t need inflated numbers to make the case, the real figures already separate Solana from the rest of the field.
Solana Cut Its Block Time And Settlement Got Faster Again
Upgrades just keep coming as well. On August 21, 2026, mainnet slot times dropped from 400 milliseconds to 350 milliseconds (the first cut of its kind since the network’s 2020 launch), with average confirmation speeds settling near 370 milliseconds in the days that followed.
A faster slot time compounds in ways that don’t show up on a single chart. Front-running and sandwich-attack windows shrink along with block time, tightening spreads and cutting failed transactions for anyone trading on-chain. High-frequency trading and DeFi protocols, both famously impatient, benefit directly from faster finality, and the wait between clicking confirm and watching a transaction settle keeps closing in on something closer to swiping a card than waiting on a blockchain.
Retail users don’t actually notice the millisecond figures themselves, noticing instead the loading spinners that disappear and the transactions that clear before there’s time to second-guess them. Developers stress-testing lending protocols at odd hours feel the difference first, watching order fills settle before a loading icon even finishes its first spin.
Each cut to block time adds to a run of infrastructure work stacking up behind the price line, narrowing the space between what the network can already do and what the chart is still pricing in.